Black Trustee Alliance

Turning national research into a digestible and scannable report

Industry

Arts & Culture, Non-profit, Research

Role

Designer

Disciplines

Editorial Design, Data Visualization, Illustration, Presentation Design, Social Media Design

When

July to September 2026

Tools Used

InDesign, Figma, Illustrator

overview

Design for a Field-Shaping Survey

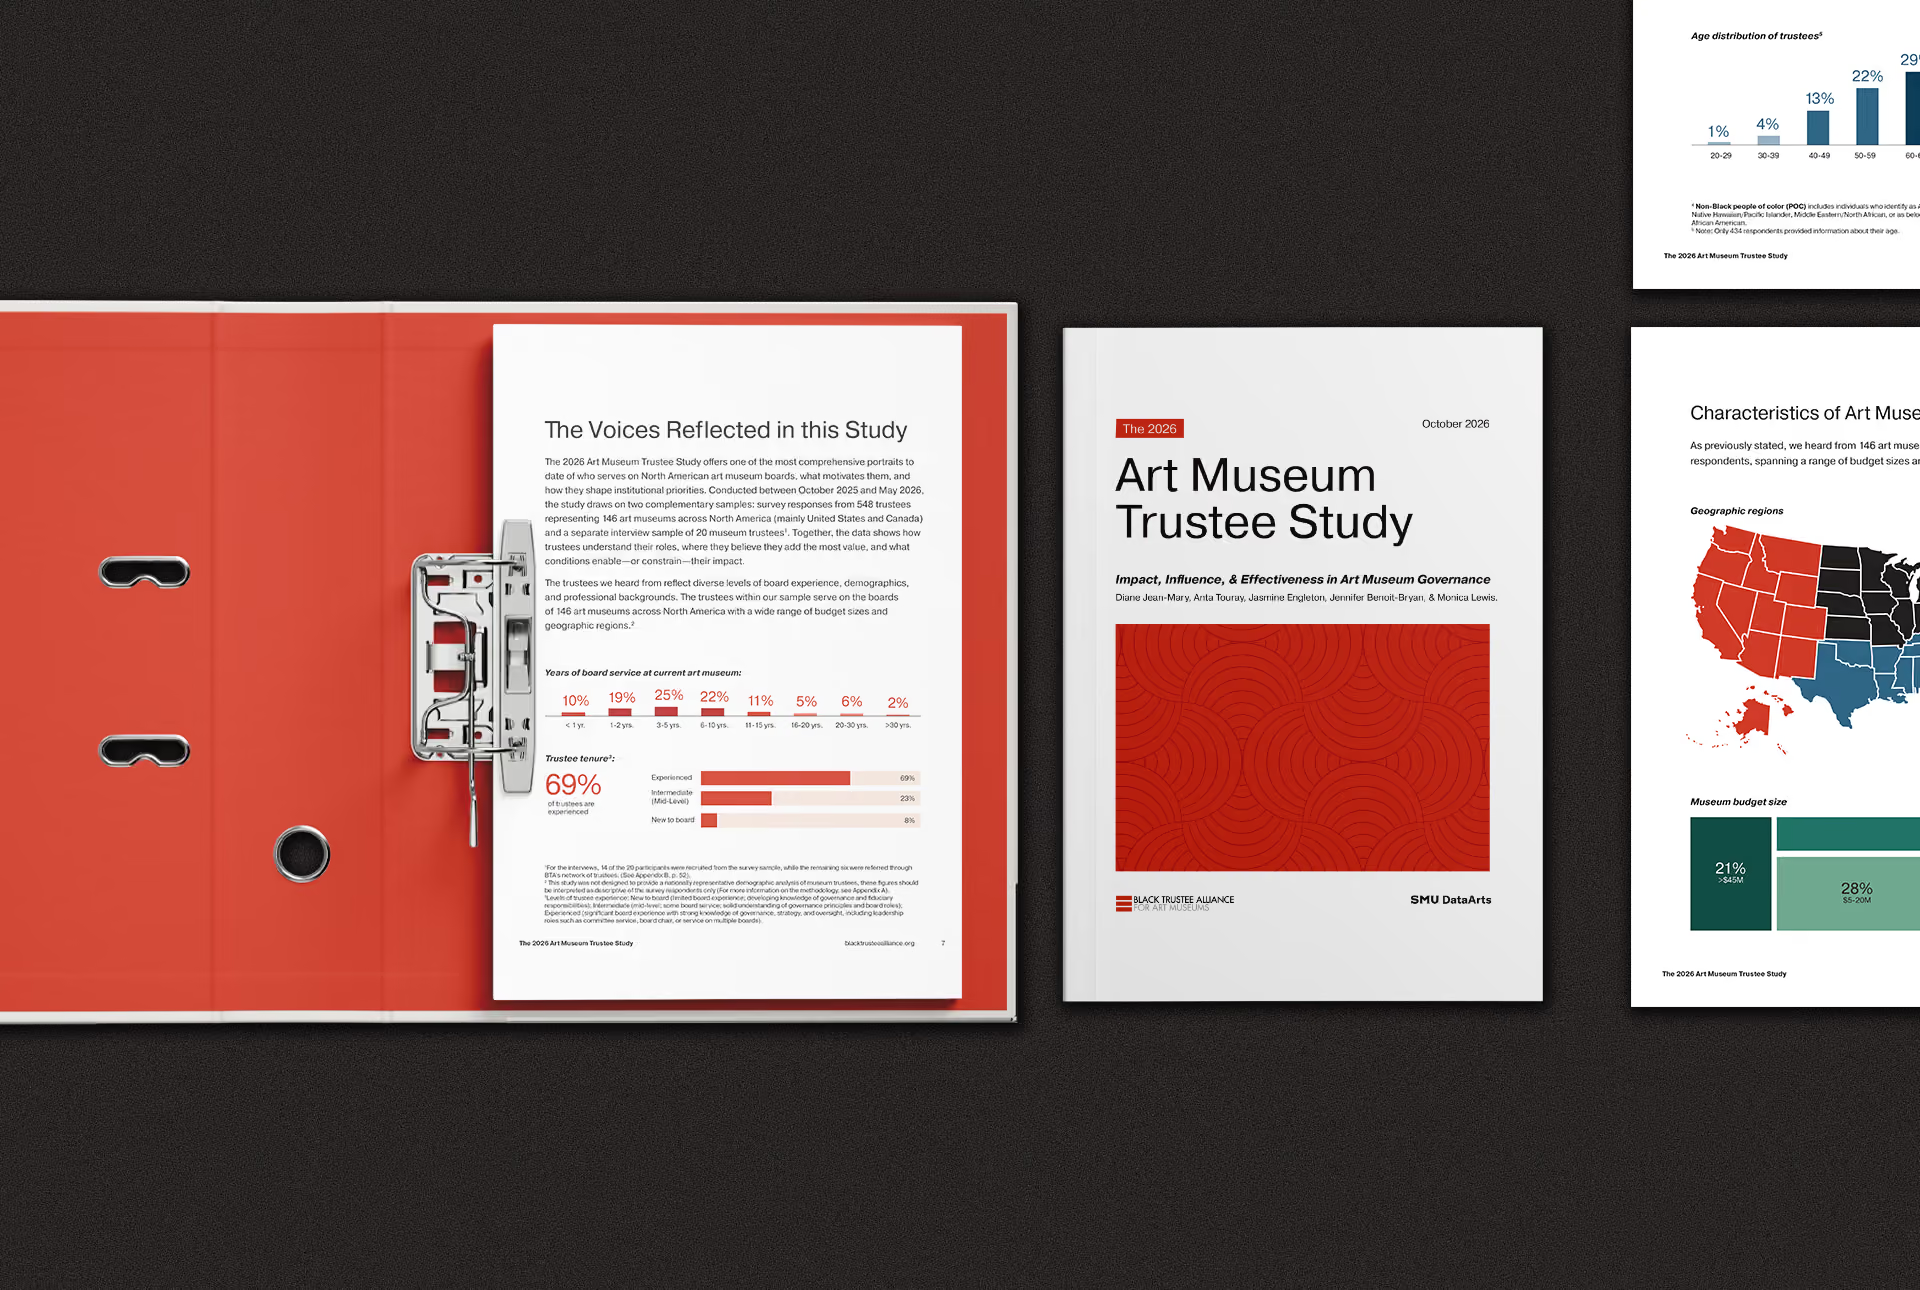
Black Trustee Alliance for Art Museums (BTA) is a national network of Black trustees working to make art museums more equitable. For the 2025-2026 Art Museum Trustee Survey, BTA partnered with SMU DataArts to study the experiences, influence, and impact of trustees across the country. I was brought on as the design partner to turn those findings into a published report and a toolkit of companion assets for the September 2026 launch. The work covered three areas: the report itself, the data visualizations inside it, and the social media and presentation templates that carried the research beyond the page.
The Report

Challenges

The report had to serve very different readers: trustees, museum directors, funders, researchers, and journalists. It needed the authority of a research publication without the density that makes one hard to finish.

  • Make a data-heavy report easy to scan and easy to trust
  • Create a visual language that felt credible to the arts sector and true to BT
  • Keep layouts consistent while allowing room for quotes, callouts, and key stats

Strategy

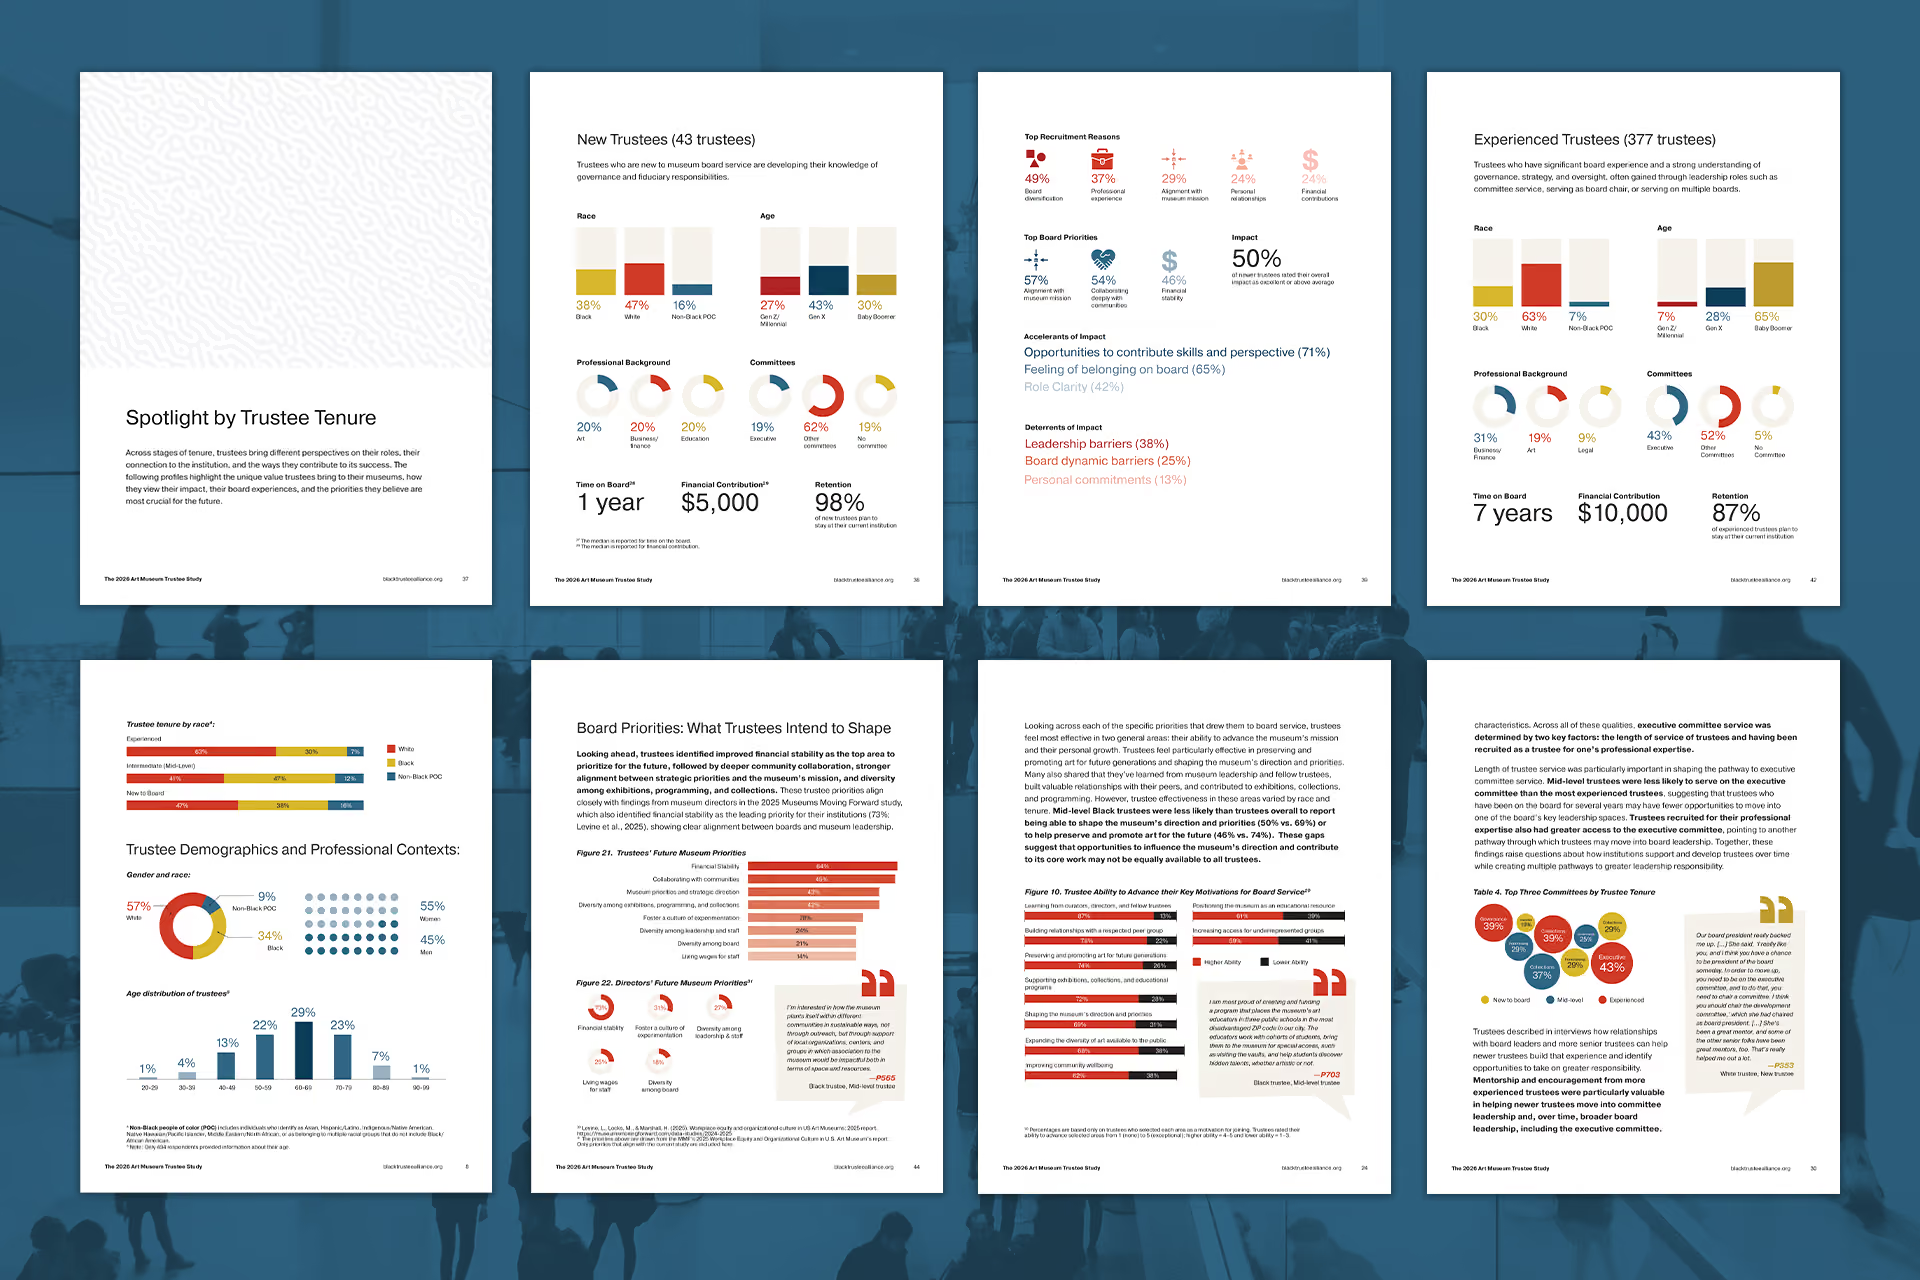
I started by mapping the report’s narrative before designing a single page, so the layout could follow the story instead of fighting it. Divider pages separate the major sections, with illustration used as a signal that the reader is moving into a new part of the story. Interior pages use a clear hierarchy for headlines, body copy, pull quotes, and stat callouts.I worked closely with BTA’s team through multiple review rounds. Feedback shaped the details: a standard report-style table of contents with right-aligned page numbers, a quieter footer with the study citation, page number, and website, and logos reserved for the cover. A defined footnote system kept citations at the bottom of the page and chart notes directly beneath the charts they clarify.

Charts and Data Visuals

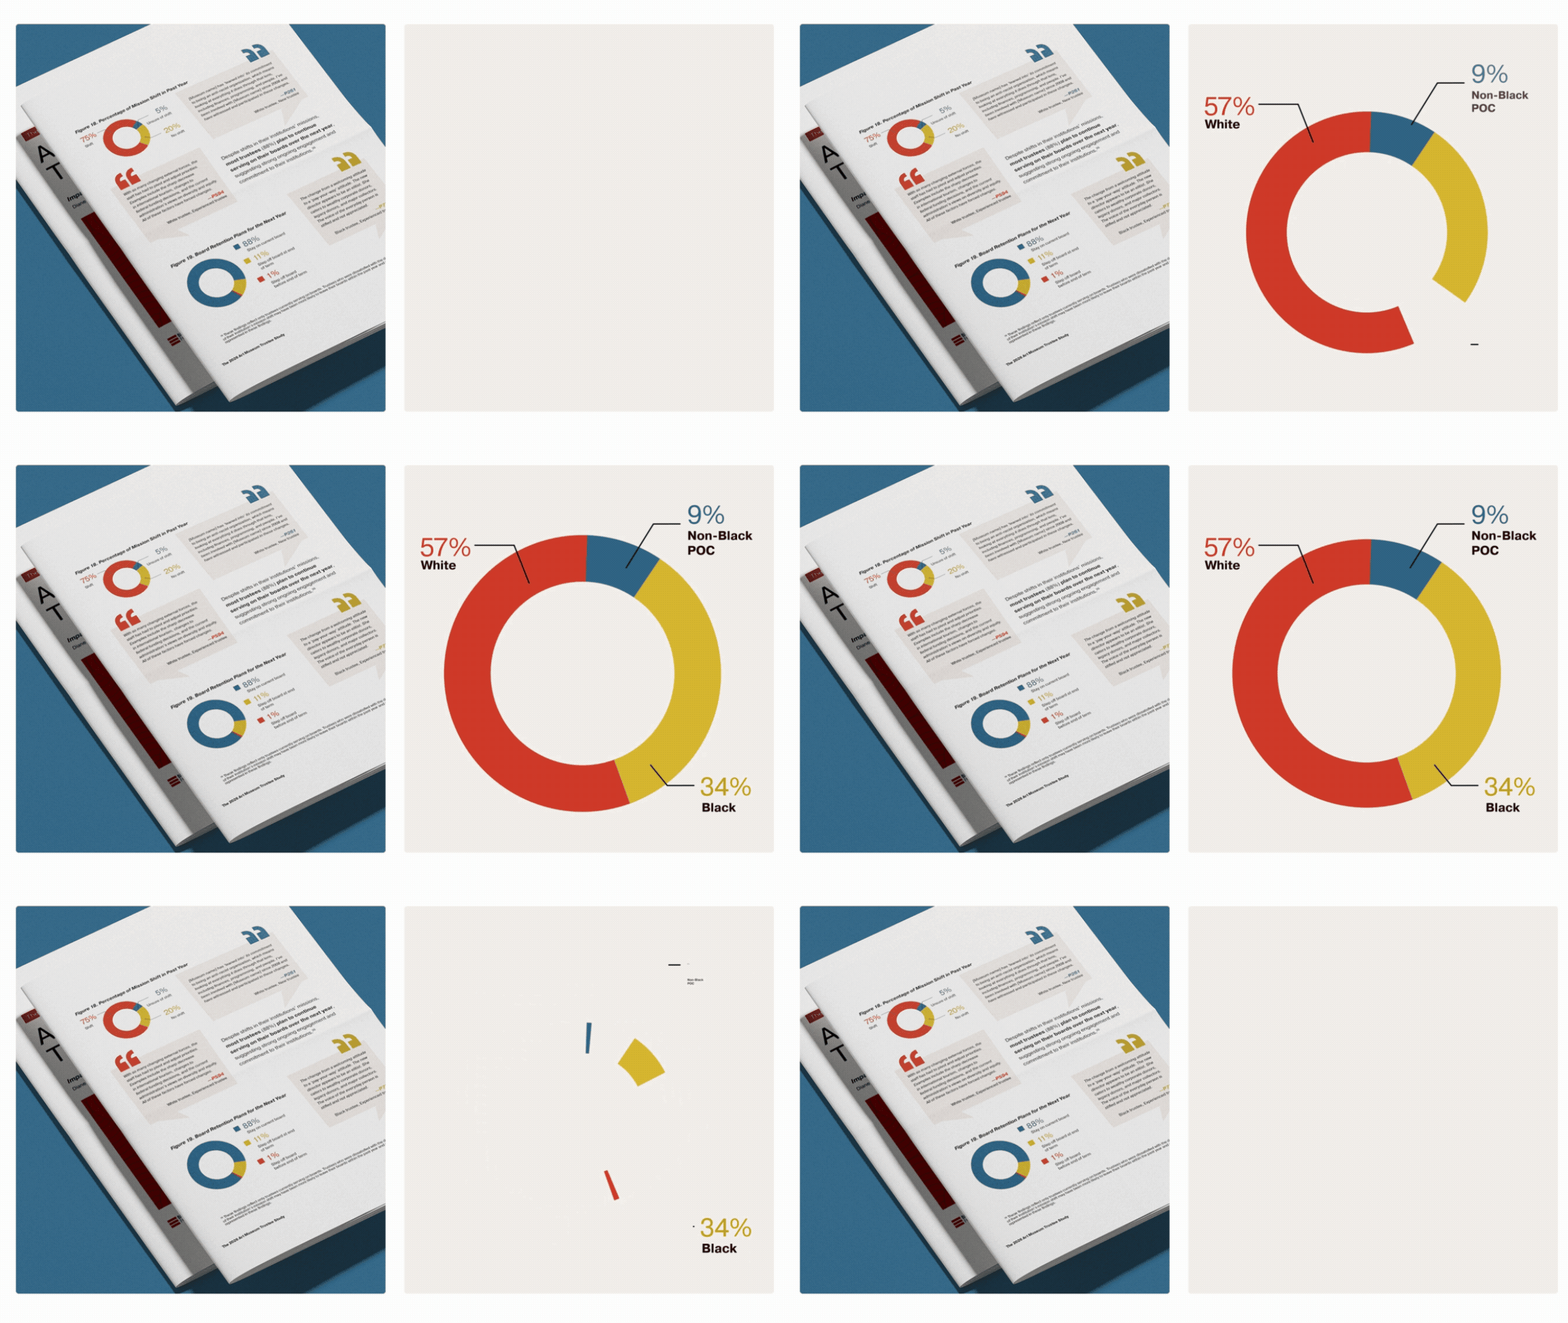
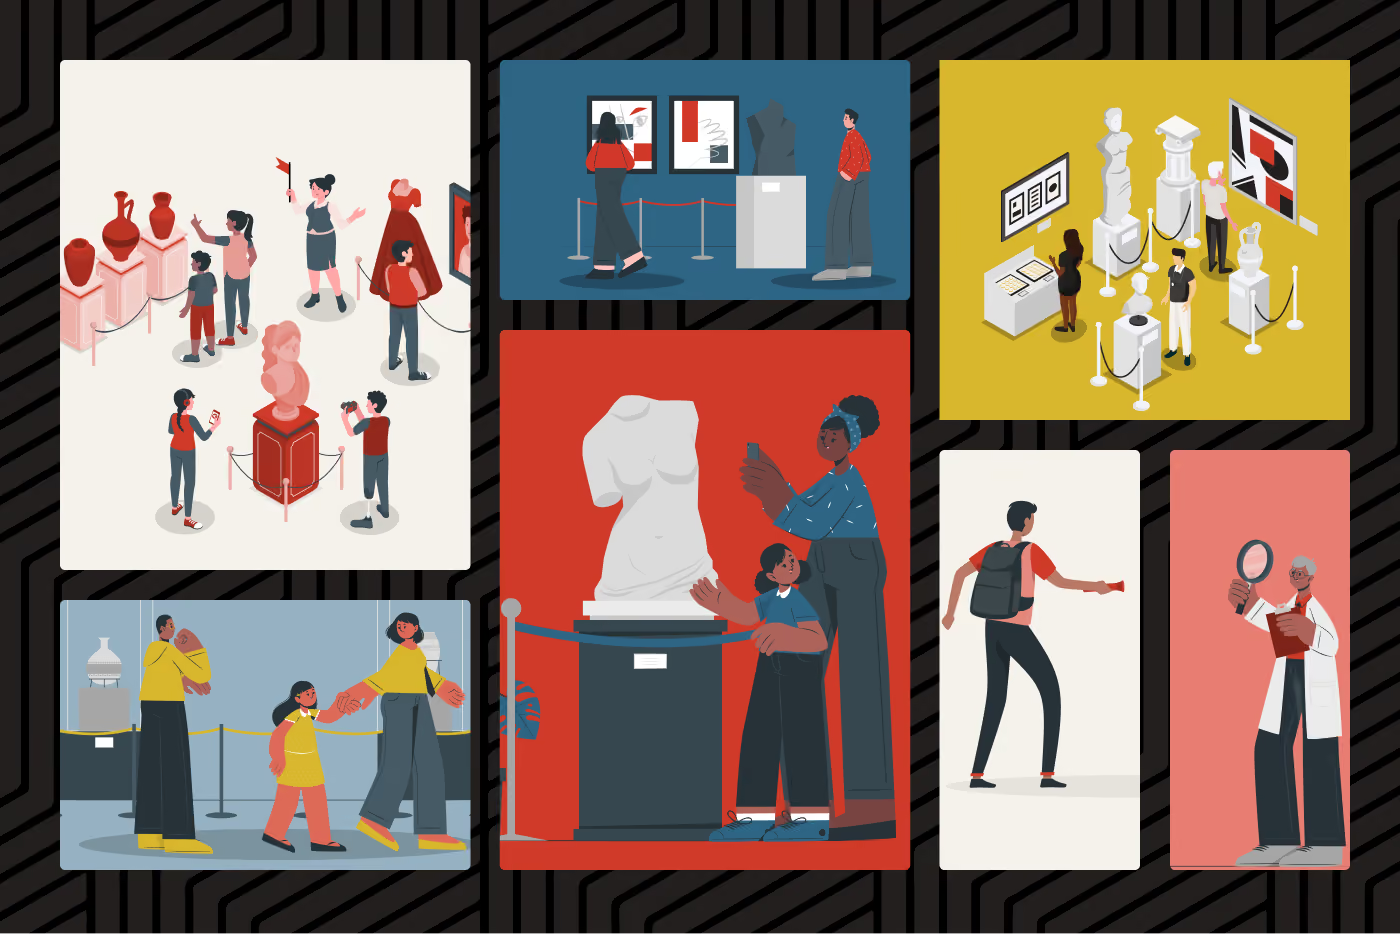
I built each chart in Figma first to keep proportions accurate to the percentage, then moved them into the layout. A fuller chart palette blends BTA’s blue with red, beige, and black, giving charts that compare several attributes enough distinction to stay clear. A custom icon set supports the data, and people-centered illustrations give the research a human presence, since the survey is about real trustees and not only numbers.

Social Media & Presentation

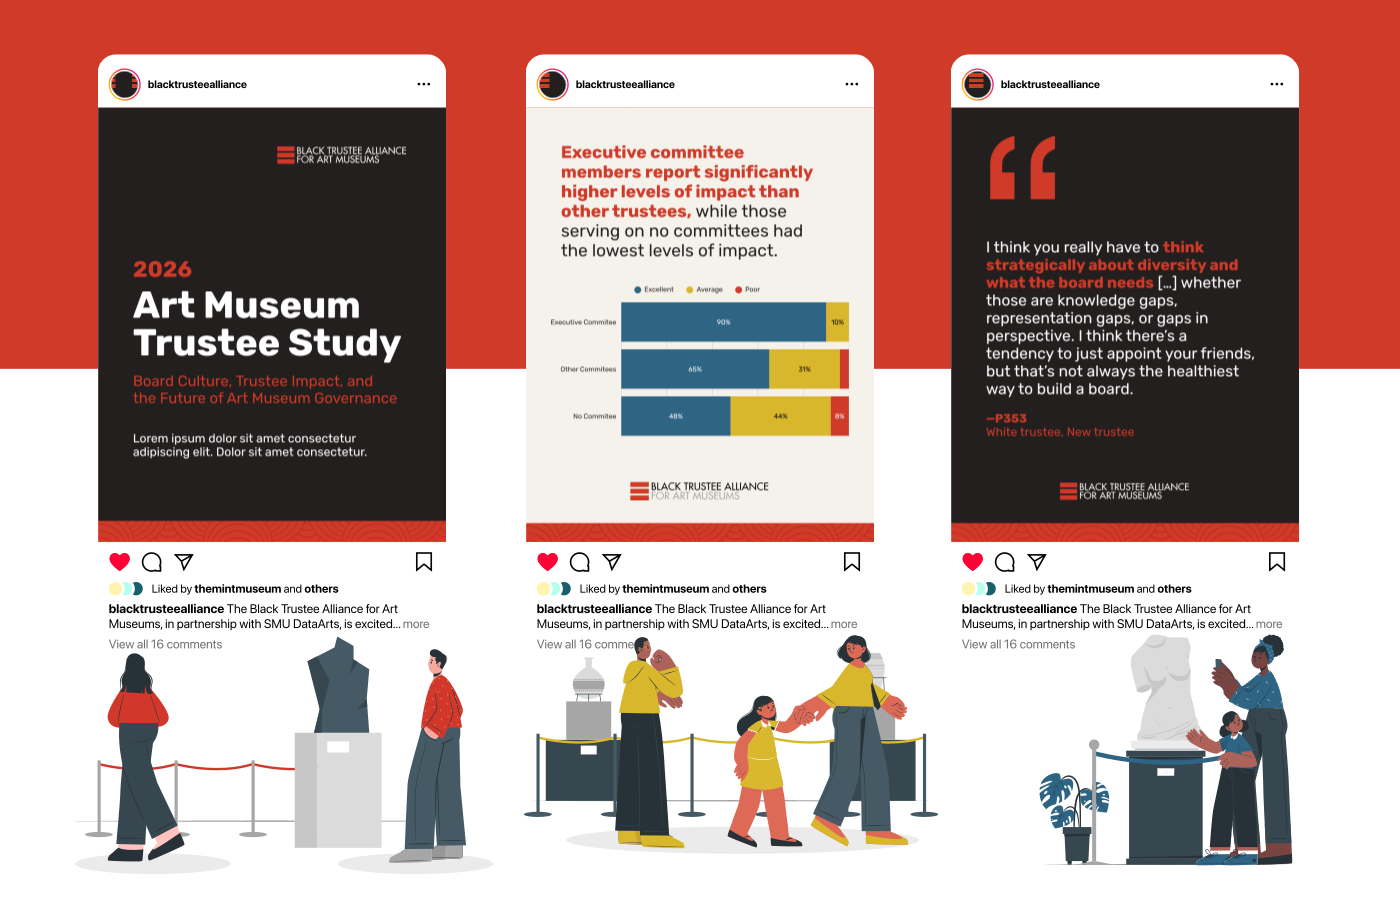
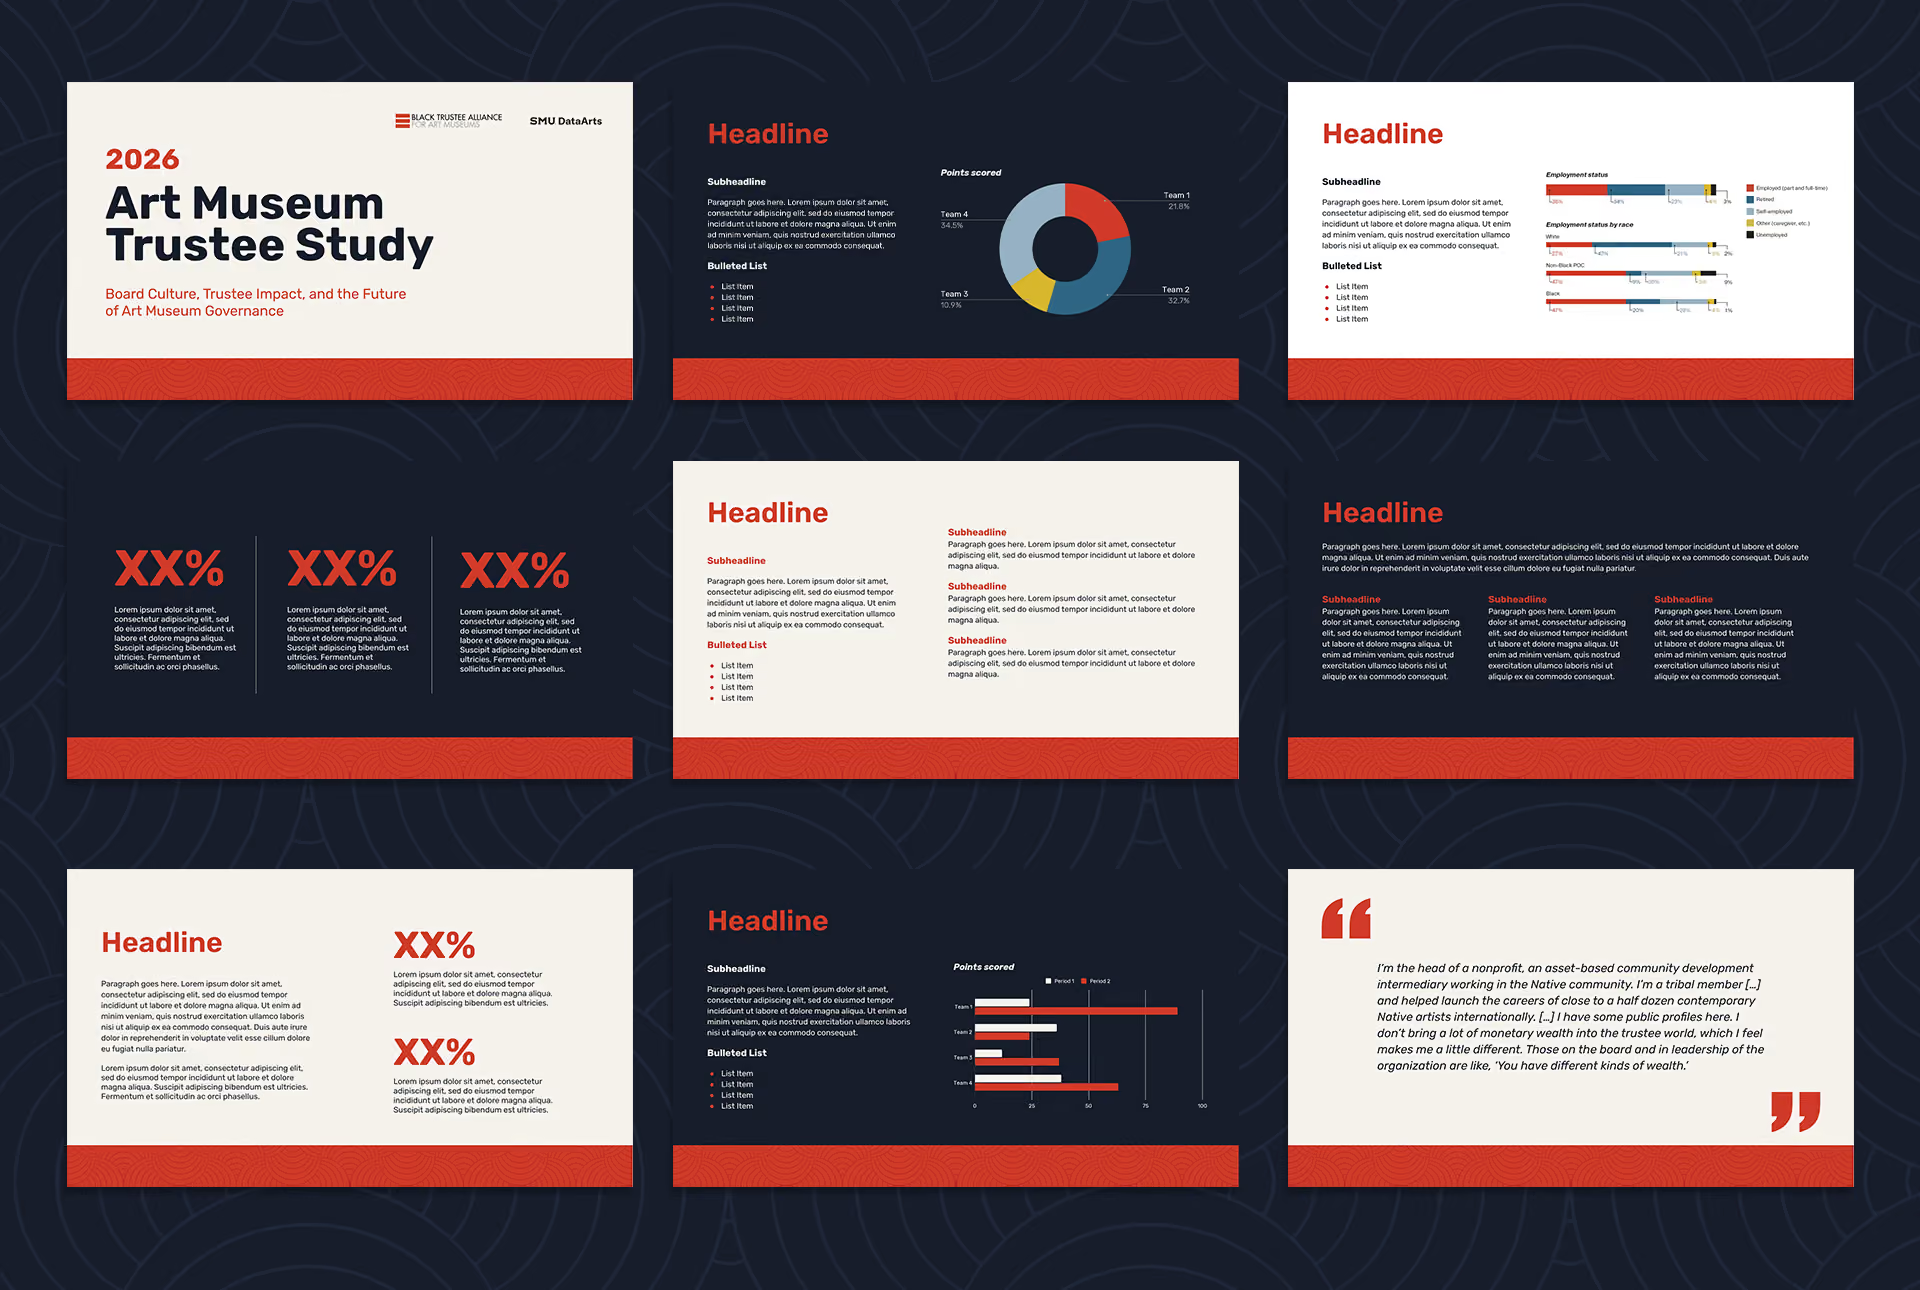
Research reaches people through more than a PDF. I extended the report’s colors, typography, illustration style, and data treatments into social media templates, a launch announcement graphic, and a Google Slides template with cover and chapter slides. A stat shared online or a chart shown in a boardroom stays connected to the original report, and BTA’s team can use every piece without a designer.

Let’s build something intentional.

If you’re looking for a creative partner who can lead strategy and execution, Iet's connect.

Get in touch
Terms & Conditions